Introduction
Install the package, understand the data model, and prepare publishing. Start with Getting started.
Introduction
Install the package, understand the data model, and prepare publishing. Start with Getting started.
Charts
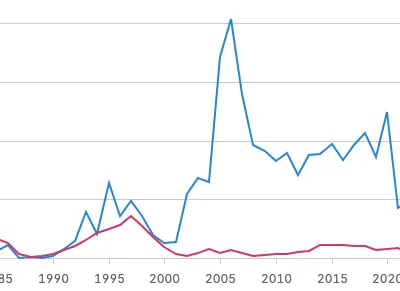
Learn when to use each chart type and how to configure it. See the Bar chart and Line chart pages.
Guides
Follow practical step-by-step walkthroughs, starting with Sizing and responsiveness.
Reference
Browse options, defaults, and type-level details, starting with Chart options.